The Chi-square Test of Independence.
The chi-square test of independence is used to
test whether two populations or variables are related or independent to
each other with
respect to some characteristic.
1. Know when to use the chi-square test for independence.
The chi-square test of independence is used to test when two
categories (each with many cells or groups) are related or not related
(independent).
Sometimes individual items are classified into categories in terms of
two different criteria. For example, in studying the wear of tires, tires
may be classified into two categories: (1) front and rear as well as
(2) left and right. A detail examination of both classification yields
a
matrix or table of possible combinations of the classifications:
| Category 1 | Category 2 | Row Total | |
| Front (F) | Rear(B) | ||
| Left (L) | fLF | fLB | fL (Left Total) |
| Right (R) | fRF | fRB | fR (Right Total) |
| Column Total | fF (Front Total) | fB (Rear Total) | n (Total of All Categorized Cells) |
The table above where categorical cells are combined to show their rows and column totals is called a contingency table.
Example 2 (from Textbook). For two categries: (1)
Political candidates, A and B and (2) Voter Types, Male or Female a reporter
may summerize a survey of perference for either candidates as follows
(contingency table):
| Voters | Candidates A | Candidates B | Total Voter Types |
| Female | Female Votes for A | Female Votes for B | Female Votes |
| Male | Male Votes for A | Male Votes for B | Male Votes |
| Total: Votes per Candidates | Votes for A | Votes for B | All Votes |
2. Know how to setup a Contingency
Tables for the chi-square tests when studing
independence (or homegeneity ) of
categorical data.
A contingency table organizes the results of a study involving
two categoriies (with many classifications within each category) by
showing the frequency for each subtotals (groups, classes or cells)
within each category.
A contingency table (Observed
frequencies) is constructed as followed:
| Criterion A | Criterion B | Row Total | |||
| 1 | 2 | ..... | k | ||
| 1 | f11 | f12 | ..... | f1k | Row1 |
| 2 | f21 | f22 | ..... | f2k. | Row2 |
| . | . | . | ...... | . | . |
| . | . | . | ...... | . | . |
| m | fm1 | fm2 | ..... | fmk | Rowm |
| Colum Total | Column1 | Column2 | ..... | Columnk | n (Grand Total) |
Where:
| m= | The number of classes of grouping in category A (Row Classification) |
| k= | The number of classifications of category B (Column Classification) |
| Rowi = | Total of row frequencies (observed) |
| Columnj = | Total of column frequencies (observed) |
| fij | Number of items or results that belong to both
the i-th and j-th categories
For example, for f12 i=1 and j=2 so is the frequency observed for both criteria when Criterion A is 1 and Criterion B is 2. |
| n= | Grand total (total number of observations) |
3. Know how to compute the expected freguencies for chi-square test of independent charateristics.
Each cell in the contingency table have some theoretical or expected
frequency and unless otherwise known (explicitly) it is determined
from the information given in the row, column and grand totals.
The expected frequency, E for each cell is determined by taking
the product of the corresponding row and column totals divided by the
grand total.
![]()
4. Know the relationship between the observed and expected frequencies and the chi-square test of independence.
The chi-sqaure test for independence evaluates the closeness of the
observed frequencies (O) fij
to the expected frequencies (E), Eij,
good agreement between these two information favors the null hypothesis
and large departure of the observed frequencies from the expected
frequencies favors the alternate hypothesis (larger values of ![]() ).
).
Remember the chi-square statistics is ![]()
5. Know the multiplication rule for independence characteristics and its role in chi-square analysis.
The cell frequencies found in the contingency table when divided by
the grand total yield the proportions, p of observations
or results out
of the total number of observations. This proportions is also a probability
score of cells posibilities out of total possible outcome or score.
If p(m) is the proportion of rowm
(frequency of rowm divided by the grand total
and p(k) is the column proportion of columnk
(probability, pk)
then:
The multiplication rule for independent characteristics is p(m and k) = p(m) x p(k).
Where p(m and k) or
p(mk) = is the probability or frequency of both m and k occuring
(assumes that both m and k are indepedent events
is the probability or frequency of both m and k occuring
(assumes that both m and k are indepedent events
or charateristics)
Example (Observed Proportion - from table below) ![]()
( Expected Proportion - from table below) ![]()
The chi-square test of independence attempts to compare the expected
proportions using the multiplication rule of independent characteristics
with the actual or observed proportions in each cell of the contingency
table.
If the multiplication rule does not hold for each cell, the two charateristics are not independent, they are related.
That is, the sum of square of the Observed frequencies minus the expected is small.
![]() I is small.
I is small.
6. Know how to compute and evaluate the chi-square test of independence statistics.
Problem: A researcher wants to
study how 7 methods of preparations affects students getting over 80% on
a aptitude test. The researcher
would also like to know how elapsed time after preparation affects
student's performance on the test (> 80%) after 1, 2 and 3 months of final
preparation and if these two criteria are related or independent.
The following table is the observed results of the study: contingency table.
Use chi-square test for independent charateristics to evaluate this
data.
| Number of Months (M) after Prep. | Methods of Prep. (preperation) | Row Totals | ||||||
| 1 | 2 | 3 | 4 | 5 | 6 | 7 | ||
| 1. After 1 M | 97 | 8 | 18 | 8 | 23 | 21 | 5 | 180 |
| 2. After 2 M | 120 | 15 | 12 | 13 | 21 | 17 | 15 | 213 |
| 3. After 3 M | 82 | 4 | 0 | 12 | 38 | 25 | 19 | 180 |
| Column Totals | 299 | 27 | 30 | 33 | 82 | 63 | 39 | 573 |
Procedure for calculating chi-square test of independence:
Step 1. Make a problems statement: (becomes the hypothesis statement, Ho ).
(1) Are the Methods of preperation and number of months after preperation related in terms of students achievement scores (> 80% on test)?
(2) Are the two criteria (methods of Preperation and number of months
test is taken after preperation) independent or related to with respect
to students performance scores (>80% on test)?
Note: that the formulation of a problems statement or the question that
the research would like to answer statistically may take on many forms
but similar expectations. For both problems statements above (1) and
(2) are inversely related for when on is true the other is false and when
on is
false the other is true. Either statement answers the larger question
of indepedence: Yes of No?
Hypothesis:
So Ho (null hypothesis): Methods of Prep and Months after Prep are independent. (not related or interacts with respect to students scores).
![]()
Ha: Ho is not true. (alternate hypothesis): Methods of Prep and Months after Prep are related.
![]()
Step 2. Choose ![]() ,
the significance level of the test.
,
the significance level of the test.
If you want the be 95 % certain that the test is true, then ![]() = 0.05 =(100-95)/100
= 0.05 =(100-95)/100
The df = (r-1)(c-1), or (m-1)(k-1) = (3-1)(7-1)=12
So df = 12
Step 3. Look up ![]() from chi-square
table:
from chi-square
table:
| df | ||||||||||
| 12 | 3.07 | 3.57 | 4.4 | 5.23 | 6.3 | 18.55 | 21.03 | 23.34 | 26.22 | 28.3 |
For d.f. = 12, ![]()
Step 4. (4) Determine or compute ![]() ,
The Expected Frequencies:
,
The Expected Frequencies:
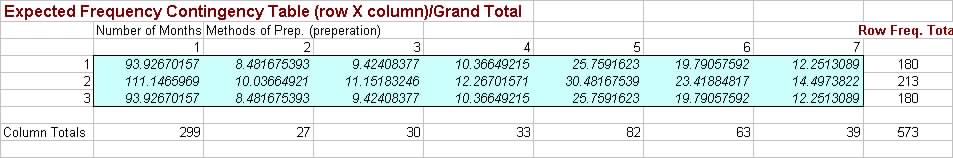
The following table is the Expected Frequencies, E of each cells
in the study:
| Number of Months (M) after Prep. | Methods of Prep. (preperation) | Row Freq.
Total |
||||||
| 1 | 2 | 3 | 4 | 5 | 6 | 7 | ||
| 1 | 93.9267 | 8.4817 | 9.4241 | 10.3665 | 25.7592 | 19.7906 | 12.2513 | 180 |
| 2 | 111.1466 | 10.0366 | 11.1518 | 12.267 | 30.4817 | 23.4188 | 14.4974 | 213 |
| 3 | 93.9267 | 8.4817 | 9.4241 | 10.3665 | 25.7592 | 19.7906 | 12.2513 | 180 |
| Column Freq. Totals | 299 | 27 | 30 | 33 | 82 | 63 | 39 | 573 |
Step 5. Compute ![]()
Table of Expected Values (click for larger image)
 |
(click for larger image)
 |
![]() = 45.5974 from computational
table above.
= 45.5974 from computational
table above.
Step 6 Perform test chi-square test: ![]() ,
,
Since ![]() ,
i.e. 45.60 > 21.03, Then we assume
that the Null Hypothesis is not true (the types of preparations and number
of weeks
,
i.e. 45.60 > 21.03, Then we assume
that the Null Hypothesis is not true (the types of preparations and number
of weeks
after preperation are related each other).
Make Conclusion or inference:
There seems to be some relationship between types of students' preparation and number of weeks after preparation that tests are taken.
So Ha (alternate hypothesis) is favored by this test.
Workshop Problem: (Test of Independence)
Formulate an hypothesis about the relationship between Political view
and Opinion of Nuclear Power from the following survey of 100 students.
Use a chi-square test for independence showing contingency table to
evaluate your hypothesis and make inference about the results of this study.
| Opinion | Political Views | ||
| Democrat | Republican | Independent | |
| Approve | 10 | 15 | 20 |
| Disapprove | 9 | 2 | 16 |
| Undecided | 8 | 2 | 18 |
(a) What is your hypothesis?
(b) What is the value of the chi-square statistics?
(c) What conclusion did you make?
(d) What inference can you make?
Use use contingency table to help
evaluate.