Introduction: The Chi-square Analysis
In general the chi-square analysis is used when there is a need to examine the similarities between two or more populations or variables on some characteristics of interest. (other statistical test do pairwise comparison, but the chi-square can handle more than one variable or population at the same time). It is often compared to the t-test for comparing mean since it compares non normal population distributions.
1. Know what is meant by categorical data.
Categorical data is a grouping of data according to similar characteristics in a way to show the relative frequencies of each group or category.
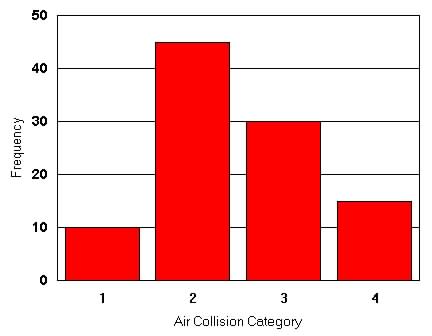
Example: For the category called Air Collision the classes or groups within that category could be: (1) between two collisions in the air, (2) collisions with ground, (3) collisions with water, (4) other types of collisions.
Table 11.1 and Figure 11.1 show
an example of a classification with frequency out of 100 collisions for
Air Collision:
Table 11.1 Air Collision
Note the data in table 11.1 is contrived |
Figure 11.1 Relative Frequencies
of Air Collision
|
2. Know when to use the chi-square analysis.
The chi-square analysis is appropriate when we need to do the following:
(1) Test whether two or more distributions are identical.
(2) Compare a distribution with a reference distribution such as the normal distribution.
(3) Compare the proportions or frequencies of categorical data (Goodness-of-Fit)
(4) Compare the independence of two characteristics (such as air collision and flight maintenance schedules) or how tehy are related to or independent of each other (Test of Independence)
(5) Test whether different populations are similar (or homogeneous) to some common characteristics. (Test of Homogeneity)
(6) Use to make inference about the population variance.
3. Know the maximum expected frequencies needed for a chi square test.
A rule-of-thumb for proper interpretation of chi-square tests is not to have the expected frequency of groups or classes of cells within the category less than 5
When situations occurs in which frequencies are less than 5, groups or cells may be combined into larger cells or groups. Rows or columns of categorical data should not be combined if no meaningful interpretation can not be made of the new grouping.
4. Know the meaning of the 3 different types of chi-square analysis techniques.
(1) Goodness-of-fit test is a chi-square test technique used to study similarities between proportions or frequencies between groupings (or classification) of categorical data.
(comparing a distribution of data with another distribution of data where the expected frequencies are known).
(2) Tests of Independence is a chi-square technique used to determine whether two characteristics (such as food spoilage and refrigeration temperature) are related or independent.
(3) Test of Homogeneity is a chi-square technique used to study whether different populations are similar (or homogeneous or equal) in reference to some characteristic or attribute (such as "do students national identity affects the time spend doing homework?").
5. Know the test statistics used to determine the chi-square statistics.
The chi-square, ![]() statistics is:
statistics is:
![]() ,
where O represents the observed frequencies and E
represents the expected frequencies.
,
where O represents the observed frequencies and E
represents the expected frequencies.
The observed frequencies, O is the proportions relative to the total from experimental studies or observations of group or class within the category of interest (a distributions similar toFigure 11.1). The observed frequencies are also called the observed cell frequencies.
The expected frequencies, E is the known proportions of frequencies of each group or class of data within the category's grouping. These known frequencies or proportions are often generated from mathematical formulas or established standards or theoretical arguments or historical data.
The expected frequencies are also called the expected cell frequencies.
6. Know how to determine the degree of freedom required for each type of chi-square tests.
The degree of freedom, df, is a parameter used to look up chi-square values from the chi-square distribution table. It is related to thesample size or number of classification of data within a category.
For the goodness-of-fit test the df = k-1, where k is the number of groups or cells within the category.
Example: For Table 11.1, k = 4 and df = 4-1 = 3, so the degree of freedom is 3.
For both the independence and homogeneity tests the df = (r-1)(c-1), where r = number of rows and c = number of columns in the contingency table.
For study involving variance, df = n-1, where n is the sample size.
7. Know how to determine the expected values, E.
Unless otherwise given the expected value, E (the theoritical or known frequency) for each groups or cells in a chi-square frequency table can be obtained or calculated as follows:
Goodness-of-fit: E = np, where n = sample size and p = proportion for each group within a category (cell).
Independence and Homogeneity: ![]()
8. Know the general strategy used for determining chi-square analysis.
(1) Set up Hypothesis: Null Hypothesis, H0 ( ![]() )is grouping or categories the same or equal to known p? The alternate
hypothesis, Ha is H0 is not true .
)is grouping or categories the same or equal to known p? The alternate
hypothesis, Ha is H0 is not true .
H0: O = E, Frequencies are close for observed and expected distributions.
(2) Choose ![]() ,
the significance level of the test.
,
the significance level of the test.
(3) Look up ![]() for appropriate degrees of freedom in the chi-square
table.
for appropriate degrees of freedom in the chi-square
table.
(4) Determine or compute ![]() ,
the theoretical value, E, for each category or grouping within category.
,
the theoretical value, E, for each category or grouping within category.
Where n is the sample size and p is the proportion.
(5) Compute ![]()
(6) If ![]() ,
conclude that the material, product, process, or grouping differs from
the standard or expected proportions in the categories;
,
conclude that the material, product, process, or grouping differs from
the standard or expected proportions in the categories;
Otherwise, there is no reason to believe that they differ or they are
not the same, the null hypothesis.