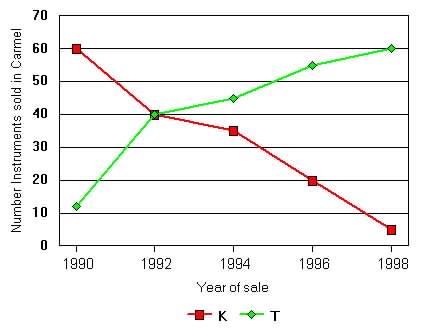
2. Shows frequencies or magnitude of data
3. Time plotted on x-axis (horizontal axis)
4. Can have many different lines representing different data types
5. X-axis mostly discrete values
6. Appropriate for continuous data measured on either an interval or ratio scale.