2. Best straight line to match data called regression line
3. Degree of agreement measures by correlation
coefficent
(0 = no agreement, +1= possitive
agreement, and
-1 strong inverse agreement)
|
|
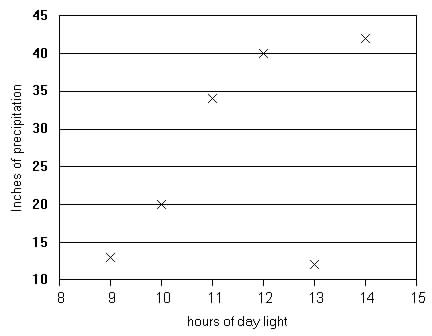
Scatter Plot |
Scatterplot: Graphing Excel Programs
| 1. Compare
pair of data to look for relationship
2. Best straight line to match data called regression line 3. Degree of agreement measures by correlation
coefficent
|
| Scatter
plot
|