($1000)
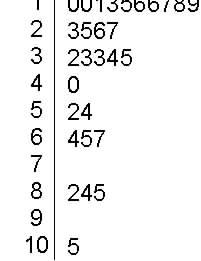
10, 10, 11, 13, 15, 16, 16, 17, 18, 19, 23, 25,
26, 27,
32, 33, 33, 34, 35, 40, 52, 57, 64, 65, 67,
82, 85, 105
1. Maintains data in original form
2. Presents data in aOrdered set
3. Shows data by groups or frequencies
4. Shows data clusters or gap in data