Discrete Random Variables - Probability Distributions
A probability distribution is similar to a frequency distribution or a histogram. Defined characteristics of a population selected randomly is called a random variable and when the values of this variable is measurable we can determine its mean or average or expected value and also its variance and standard deviation.
Review: frequency distribution, mean and variance
1. Know what is meant by a random variable.
A random variable is a numerical quantity whose value is determined by chance.
In research one is often asked to study a population, the researchers must therefore define or select characteristics of the populations that they which to study or measure, the characteristics of a population that one wishes to study is called a random variable and its possible values is the sample space.
The values of the sample space is subject to chance and is therefore determined randomly, these values are said to have been occurred or observed.
Examples of Random Variables:
| Your income next year | Your score on the next exam |
| Tomorrow's high temperature | The number of errors in a phone book |
| How long you wait for a soda | IBM's quarterly dividend |
| Length of a movie line | The height of the next person you see |
| Amount of money you will lose | Your GPA for the present term |
2. Know what is meant by a continuous or discrete random variable.
A discrete random variable is one that can assume only integer (whole number, 0, 1, 2, 3, 4, 5, 6, etc. ) Values.
Example: Response with Yes - No values, Maximum Number of adult that can fit into a car (4 , 5, 6 or 7), Year (2002), etc.
A continuous random variable is one that can assume any value over a continuous range of possibilities.
Example: Time of day (12:31:24 p.m.), Temperature (60.31450 F, Weight (154.25 pounds), etc.
A continuous random variable may be reported along an interval which show the range of possible values, sample space, such as the for the random continuous variable, x, the height of a grown man: on estimate would be 4 feet < x < 7 feet (Interval).
3. Know how to determine the probability distributions of discrete random variables.
The probability distribution of a discrete random variable is similar to a frequency distribution of that variable. This distribution may be illustrated or represented by either a table or a graphical presentation such as a histogram.
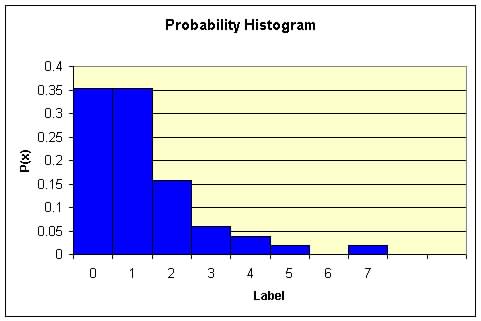
Example: Consider an experiment to count the number of customers arriving during a specific time interval (say, number arriving at 10 minutes intervals). The discrete random variable would be the number of arrivals during the time interval, let's say that the possible numbers arriving is either, 0, 1, 2, 3, 4, 5, 6, and 7 or greater. A results of such an experiment would look something like this:
The Pr[x] or P(x) or frequency of x is the cell frequency divided by total number of observation.
Frequency Distribution Table is shown in Table 5.1
Table 5.1 Number of Arrivals Probability Distribution Table
Figure 5.1 Probability Distribution Plot.
 |
Workshop Problem: Probability Distribution.
Find the probability distribution of x, if x represents a code for the
salary range of employee, assume x = 5 is the lowest range and x = 30 is
the highest range.
| Salary Range, x | Number of Salaries, f | P(x) = f/N |
| 1 | 12 | |
| 2 | 10 | |
| 3 | 7 | |
| 4 | 3 | |
| 5 | 4 | |
| 6 | 3 | |
| Total = N= | 1 |
Mean and Variance of Random Variables
The mean or expected value of a random variable is the sum of each values of the variable times its corresponding probability, p(x).
The expected value of a random variable is considered its mean.
1. Know how to determine the mean or expected value of a discrete random variable.
The computation used to calculate the mean or expected value of a random variable is similar to that used to find the mean of a grouped data.
The expected value of a discrete random variable, X, denoted by ![]() ,
is the weighted average of that variable's possible values, where the respective
probabilities are used as weights.
,
is the weighted average of that variable's possible values, where the respective
probabilities are used as weights.
![]()
The expected value is also denoted by E(x).
Example: Using example above to compute the Expected Value of x.
From worksheet below, the expected value is 1.2353.
| Number
of Arrival, x
(1) |
Numbers
of 10 minutes Interval, f
(2) |
Relative
Frequency or Probability of x, Pr(x)=f/N
(3)=(2)/N |
x Pr(x) |
| 0 | 18 | 0.3529 | 0 |
| 1 | 18 | 0.3529 | 0.3529 |
| 2 | 8 | 0.1569 | 0.3137 |
| 3 | 3 | 0.0588 | 0.1765 |
| 4 | 2 | 0.0392 | 0.1569 |
| 5 | 1 | 0.0196 | 0.098 |
| 6 | 0 | 0 | 0 |
| 7 or more | 1 | 0.0196 | 0.1374 |
| N=51 | 1 | 1.2353 |
2. Know how to compute the variance and standard deviation from a frequency distribution.
The variance of a discrete random variable is determined by the following formulas, (2) Is preferred for computational ease:
(1) Variance = ![]() ,
where P(x) is the probability or relative frequency of x.
,
where P(x) is the probability or relative frequency of x.
(2) Variance = ![]()
Example: calculate the variance
of the random variable above:
| Number
of Arrival, x
(1) |
Numbers
of 10 minutes Interval, f
(2) |
Relative
Frequency or Probability of x, Pr(x)=f/N
(3)=(2)/N |
x Pr(x) | x2 Pr(x) |
| 0 | 18 | 0.3529 | 0 | 0 |
| 1 | 18 | 0.3529 | 0.3529 | 0.3529 |
| 2 | 8 | 0.1569 | 0.3137 | 0.6275 |
| 3 | 3 | 0.0588 | 0.1765 | 0.5294 |
| 4 | 2 | 0.0392 | 0.1569 | 0.6275 |
| 5 | 1 | 0.0196 | 0.098 | 0.4902 |
| 6 | 0 | 0 | 0 | 0 |
| 7 or more | 1 | 0.0196 | 0.1374 | 0.9608 |
| N=51 | 1 | 1.2353
|
= 3.5882 |
Variance = ![]() = 3.5882-1.5260=2.0622
= 3.5882-1.5260=2.0622
And standard deviation = ![]()
Worksheet: Use the worksheet or functions below to show the probability
distribution, mean, variance and standard deviation of the random variable
x below:
| x | 0 | 1 | 2 | 3 | 4 | 5 | 6 |
| Frequency | 23 | 43 | 50 | 56 | 45 | 34 | 24 |
Worksheet for Computing the Probability
Distribution, mean and variance of a Discrete Random Variable, x.
| Number
of Arrival, x
(1) |
Numbers
of 10 minutes Interval, f
(2) |
Relative
Frequency or Probability of x, Pr(x)=f/N
(3)=(2)/N |
x Pr(x)
(4) |
x2
Pr(x)
(5) = (1) x (4) |
| N= | 1 | (7) |
||
| (6) |
Variance = (8) =(5) - (6)= Standard Deviation = |
|||