|
|
Statistical Estimation |
Statistical inference is the process of making judgment about a population based on sampling properties. An important aspect of statistical inference is using estimates to approximate the value of an unknown population parameter. Another type of inference involve choosing between two opposing views or statements about the population; this process is called hypothesis testing.
This chapter will study different kinds of estimator and lay the foundations for making statistical inference about the population mean and proportion.
Chapter 7 deals with comparison between sample statistics such as the mean and proportions and the population statistics. Often the population statistics is referred to as the standard.
1. Know what is meant by statistical estimation.
An estimator is a statistical parameter that provides an estimation of a population parameter.
A point estimator is a single numerical estimate of a population
parameter.
| The sample mean, |
Example: The mean of the age of men attending a show is 32 years.
An interval estimator places the unknown population parameter between 2 limits. It assumes or considers the errors associated with the sampling procedure.
Example: The mean of the age of men attending a show is between 28 and 36 years.
Some times inequality notations are used to indicates interval estimators.
Example: The mean of the age of men attending a show is ![]() .
.
There are two criteria used to establish the endpoints of an interval estimator:
(1) The level of precision - how sure you want to be about its values.
(2) The credibility - how believable is the estimator.
Both precision and credibility of interval estimators improves with the increasing quality and quantity of the sample.
2. Know the various types of estimators.
There are 3 criteria developed to compares statistical estimators in terms of their worth as an estimator:
1. Unbiased estimators
An unbiased estimator is a statistics that has an expected value equal to the population parameter being estimated.
Examples:
The sample mean, ![]() is an unbiased estimator of the population mean,
is an unbiased estimator of the population mean,![]() .
.
The sample variance, ![]() is an unbiased estimator of the population variance,
is an unbiased estimator of the population variance,  .
.
The sample proportion, P
is an unbiased estimator of the population proportion, ![]() .
.
Unbiased estimators determines the tendency , on the average, for the statistics to assume values closed to the parameter of interest.
2. Efficient Estimators
An efficient estimator consider the reliability of the estimator in terms of its tendency to have a smaller standard error for the same sample size when compared each other.
Examples:
The median is an unbiased estimator
of ![]() when the sample distribution is normally distributed; but is standard error
is 1.25 greater than that of the sample mean, so the sample mean is
a more efficient estimator than the median.
when the sample distribution is normally distributed; but is standard error
is 1.25 greater than that of the sample mean, so the sample mean is
a more efficient estimator than the median.
| The Maximum Likelihood Estimator is the most efficient estimator among all the unbiased ones. |
3. Consistent Estimators.
A statistics is a consistent estimator of a parameter if its probability that it will be close to the parameter's true value approaches 1 with increasing sample size.
The standard error of a consistent estimator becomes smaller as the sample size gets larger.
The sample mean and sample proportions are consistent estimators, since from their formulas as n get big, the standard errors gets small.
![]() and
and ![]()
Review point estimators of the sample mean, sample variance, and sample proportion.
3. Know how to find an interval estimate or confidence interval of the sample mean.
Based on the Central
Limit Theorem as the sample size gets large (![]() ) most random variable mean approaches that of a normal distribution whose
mean and standard deviation can be estimated by:
) most random variable mean approaches that of a normal distribution whose
mean and standard deviation can be estimated by:
Mean estimated by , ![]() and variance estimated by
and variance estimated by ![]()
An interval estimator of the sample mean can be expressed as the probability that the mean between two values.
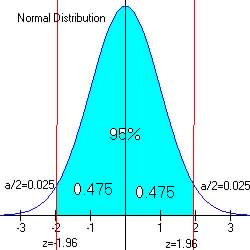
A review of the normal distribution will illustrate the probability
in terms of the interval estimate around the mean.
| Note that the shaped
area represents the probability between the interval using the z-score.
Example if the mean was 0 and the standard deviation was 1. Then a 95% or 0.95 probability estimate of the mean would Note that the area to the right of z=1.96 is 0.025 and the area to the left of z=-1.96 is also 0.025, added together they both equal 0.05, this area not a part of the probability interval of interest is called the significant level and is called many names: Example: alpha, a, |
 |
The z-score for the normal variable statistics is used to help determine the interval endpoints that correspond to the probability of degree of certainty one which to use for the interval estimator.
Remember that ![]() ,
recall that the standard deviation of the sample mean,
,
recall that the standard deviation of the sample mean, ![]() .
.
So for sample statistics based on large sample size (Central
Limit Theorem), the z-score is computed using ![]() .
.
So ![]() and since z represents the number of standard deviations above and below
the mean.
and since z represents the number of standard deviations above and below
the mean.
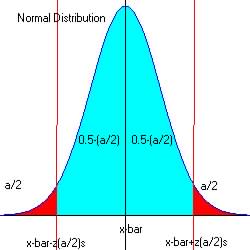
An interval estimator for the mean is given by the following:
![]() or
or ![]()
Example: Find an interval estimator of the sample mean of a random variable of sample size 49 if the population standard deviation is 5 and the sample mean is 15, Find a 95% confidence interval for the population true mean.
Given: , ![]() = 15,
= 15, ![]() .
.
Since the level of significance, alpha is 5% (100 - 95) or 0.05, so a/2 = 0.025
From the standard normal reference table, ![]() appears at the endpoints of the normal distribution:
appears at the endpoints of the normal distribution:
When the probability is 0.025 i.e. Pr[z=-1.96 ] > 0.025 and at 0.975, i.e. Pr[z=1.96] > 0.975
Between Pr[] = 0.025 and Pr[] = 0.975 the Pr[] = 0.95 = 0.975 - 0.025
So the 90% confidence interval for the example is ![]()
So CI: ![]()
| The confidence interval (
|
 |
| The maximum
error of the estimate, E, with level of confidence
The Confidence Interval, when both the mean and the standard deviations
are estimated from the sample mean and variance if
|
Example: Find the 99% confidence interval estimate of the true population mean income if a sample of 100 families gives a sample mean of $28,500. From previous experience we know that the population standard deviation is $5,000
Using alpha = 1 - 0.99 = 0.01, we find the z-values for the endpoints of the CI when the probabilities are 0.005 (a/2), z= 2.57
So our CI estimate is
![]()
![]()
Sample Size Estimates (Programs to estimate sample size)
4. Know how to determine the sample size needed to estimate the population mean with some level of confidence or level of significance, alpha.
The probability or confidence level offers level of significance, alpha for estimating the sample mean. The knowledge from the previous section can be used to find appropriate sample size, n for estimating the sample mean with some degree of certainty or probability.
Since the maximum margin of error, E is given by the formula:
![]() then solving for n, the sample size for some expected level of error, E.
then solving for n, the sample size for some expected level of error, E.
Example: If one need to find the sample size, n to determine
the mean within some CI or probability ![]() .
Then the sample size needed is determined by the formula:
.
Then the sample size needed is determined by the formula:
|
Example: A average price for gasoline is expected to be $1.45 per gallon, if the standard deviation for a Northeastern State is $0.10 per gallon. It is believed that the mean price per gallon has changed. How many samples (gas stations) should be studied so as to estimate the new NE state's mean with a maximum error of the estimate of $0.01 and a 90% level of confidence?
![]() .
= 0.90 (alpha = 0.10)
.
= 0.90 (alpha = 0.10)
From reference table (a/2) = 0.05 , z= 1.65
![]()
E = 0.01
So ![]() ,
,
So n = 273 (round up to the next integer)
Example: We wish to know the average thickness of washers in a shipment. We are willing to take a risk of 5 times in 100 that the error in our estimate will be 0.002 inch (E) or more. From a sample of another lot we estimate the standard deviation is = 0.00359 with 9 degrees of freedom.
Alpha is 5/100 or 0.05 or 5 %, so ![]() .
= 0.95 (alpha = 0.05)
.
= 0.95 (alpha = 0.05)
From reference table (a/2) = 0.025 and degrees of freedom, d.f. = 9, t= 2.262
E = 0.002
So ![]() ,
,
So n = 17 (round up to the next integer)
5. Know how to determine the sample size needed to estimate the population proportion with some level of confidence or level of significance, alpha.
The probability or confidence level offers level of significance, alpha for estimating the sample mean. The knowledge from the previous section can be used to find appropriate sample size, n for estimating the sample proportion with some degree of certainty or probability.
Since the maximum margin of error, E is given by the formula:
![]() then solving for n, the sample size for some expected level of error, E.
then solving for n, the sample size for some expected level of error, E.
Example: If one need to find the sample
size, n to determine the proportion, p within some CI or probability ![]() .
Then the sample size needed is determined by the formula:
.
Then the sample size needed is determined by the formula:
Standard Deviation Estimates from Sample Distribution
6. Know how to estimate the standard deviation from a sample distribution when no sample data are available.
Often it is necessary to have some idea of the magnitude of the variability or variance of a population characteristics when no data are available. From a frequency distribution of a plot of the data one may estimate the standard deviation given two points.
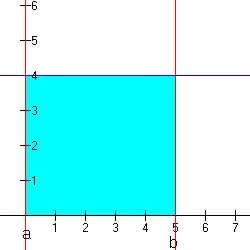
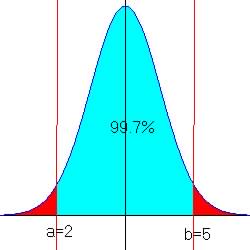
Example to estimate the standard deviation from an approximately normal distribution of data find two values a and b between which you expect 99.7% (almost all) of the data to fall within, Then, estimate
![]()
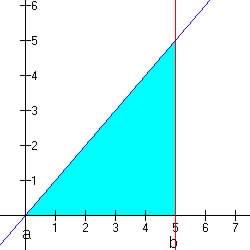
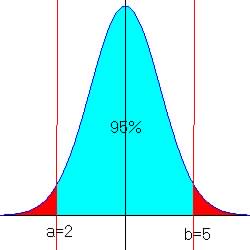
Example to estimate the standard deviation from an approximately normal distribution of data find two values a and b between which you expected 95% of the data to fall within, Then, estimate
![]()
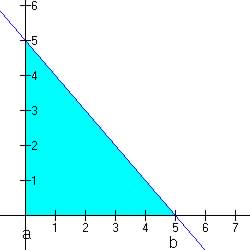
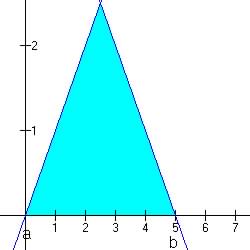
The following are estimates
of the standard deviation for some common distributions:
| Distributions | Standard Deviation |
 |
|
| Distributions | Standard Deviation |
 |
|
| Distributions | Standard Deviation |
 |
|
| Distributions | Standard Deviation |
 |
|
| Distributions | Standard Deviation |
 |
|
| Distributions | Standard Deviation |
 |
|