Test for Population Mean (large sample size).
If the sample size is large (![]() ),
then the normal approximation distribution and associated statistics can
be used to determine a test for whether the sample mean = population mean.
),
then the normal approximation distribution and associated statistics can
be used to determine a test for whether the sample mean = population mean.
That is, when the sample size is greater than or equal to 30 we can use the z-score statistics to compare the sample mean against the population mean using value of the sample standard deviation to estimate the sample standard deviation if it is not known.
There are three questions one may ask when comparing two means:
Question 1: : Is ![]() ? Ha (Two-tailed test)
? Ha (Two-tailed test)
Question 2: : Is ![]() ? Ha (Right-tailed test)
? Ha (Right-tailed test)
Question 3: : Is ![]() ? Ha (Left-tailed test)
? Ha (Left-tailed test)
1. Know the statistics used to test ![]() for large sample size.
for large sample size.
The test statistics is related to the standard normal distribution:
 |
2. Know how to use appropriate statistics to test if a sample mean is equal to the population mean (large sample size).
3 Types of tests in comparing sample mean to population mean:
When comparing the sample mean, ![]() to the population mean (
to the population mean (![]() is known) there are 3 question to considered:
is known) there are 3 question to considered:
Question 1:
: Is ![]() ? Ha (Two-tailed test)
? Ha (Two-tailed test)
Question 2:
: Is ![]() ? Ha (Right-tailed test)
? Ha (Right-tailed test)
Question 3:
: Is ![]() ? Ha (Left-tailed test)
? Ha (Left-tailed test)
Question 1:
Is ![]() ? Ha (Two-tailed test)
? Ha (Two-tailed test)
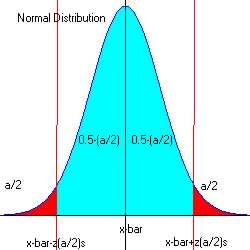
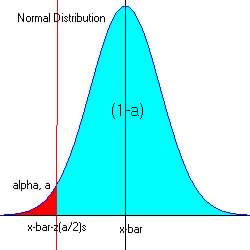
| Is Is the new mean different from the population mean? Here we use a two-tailed test by computing the confidence
interval for the test at the level of significance If the test statistics for z falls outside this interval we decide that the means differs, we chose the alternate hypothesis, Ha Otherwise we have no reason to think that they differ, H0 |
 |
By Examples:
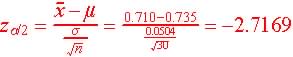
Problem 1. A company wants to know if the mean of its new product differs from the mean of the standard which is 0.735 pounds. If a sample of 30 yields a mean of 0.710 and a standard deviation of 0.0504 pounds, make a decision at the 0.05 significant level.
Given ![]() ,
n = 30 (large so can use normal approximation of z-score), s
= 0.0504 and since, n is large it can be used to approximate
,
n = 30 (large so can use normal approximation of z-score), s
= 0.0504 and since, n is large it can be used to approximate ![]() ,
the population standard deviation and
,
the population standard deviation and ![]()
Step 1 - Hypothesis: The claim that ![]() or 0.710 = 0.735, the null hypothesis.
or 0.710 = 0.735, the null hypothesis.
The alternate hypothesis is that ![]()
H0 : ![]() =
0.735
=
0.735
Ha :![]() or
or ![]()
Step 2. Select level of significance:
This is given as ![]() (5%)
(5%)
So for two-tailed test: ![]()
Step 3. Test statistics and observed value.
Step 4. Determine the critical region (favors Ha)
For alpha = 0.025 at both ends of intervals: 0.025 and 0.975, za/2
= -1.96 and z1-a/2 = 1.96
reference
table
 |
The critical region is![]() and
and ![]()
Step 5. Make decision.
No not reject the null hypothesis if ![]() or
or ![]()
The observed z = -2.72, and since -2.72 < -1.96 and in the critical region, we reject H0 in favor of Ha.
So the new mean of 0.710 differs from the old mean of 0.735.
Question 2:
Is ![]() ? Ha (Right-tailed test)
? Ha (Right-tailed test)
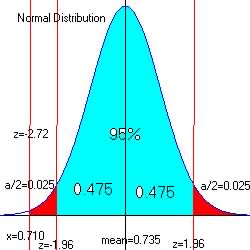
| Is Is the new mean greater than the population mean. Here we use
a right-tailed test by computing the positive z-score for the test
at the level of And if the test statistics for z falls within the critical region (red)
we decide that Otherwise we have no reason to think that they differ, Ha |
 |
By Examples:
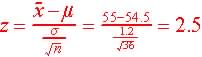
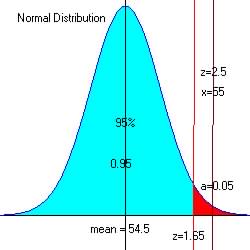
Problem 2. A business wants to know if the new trend in the mean percent response of 55 belong to the old trend with population mean of 54.5 . If the new mean was calculated from a sample size of 36 and its standard deviation is 1.2, using a significant level of 5% test the claim that the old trend is equal to the new.
Given ![]() ,
n = 36 (large so can use normal approximation of z-score), s
= 1.2 and since, n is large it can be used to approximate
,
n = 36 (large so can use normal approximation of z-score), s
= 1.2 and since, n is large it can be used to approximate ![]() ,
the population standard deviation and
,
the population standard deviation and ![]()
Step 1 - Hypothesis: The claim that ![]() or 55 = 54.5, the null hypothesis.
or 55 = 54.5, the null hypothesis.
Since x-bar is smaller than ![]() ,
the alternate hypothesis is 55 > 54.5.
,
the alternate hypothesis is 55 > 54.5.
H0 : ![]() =
54.5
=
54.5
Ha : ![]() .
.
Step 2. Select level of significance:
This is given as ![]() (5%)
(5%)
Step 3. Test statistics and observed value.
Step 4. Determine the critical region (favors Ha)
For alpha = 0.05 at the upper end of the acceptable region (Pr[1-a]=0.95), z = 1.65
From reference
table (search for z with Pr[z=? ] = 0.95.
 |
Step 5. Make decision.
No not reject the null hypothesis if ![]()
The observed z = 2.5, and since 2.5 > 1.65 and in the critical region, we reject H0 in favor of Ha.
So the new mean of 55 is greater than the old mean of 54.5.
Question 3:
Is ![]() ? Ha (Left-tailed test)
? Ha (Left-tailed test)
| Is Is the new mean less than from the population mean. Here we use
a left-tailed test by computing the negative z-score for the test
at the level of And if the test statistics for z falls within the critical region (red)
we decide that Otherwise we have no reason to think that they differ, Ha |
 |
By Examples:
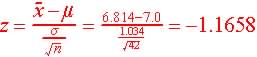
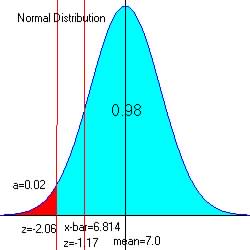
Problem 3. A sample of 42 observations averages 6.814 and the standard deviation is 1.034. Is this mean less than the existing mean of 7.0? Test this hypothesis using a 2% level of significance.
Given ![]() ,
n = 42 (large so can use normal approximation of z-score), s
= 1.034 and since, n is large it can be used to approximate
,
n = 42 (large so can use normal approximation of z-score), s
= 1.034 and since, n is large it can be used to approximate ![]() ,
the population standard deviation and
,
the population standard deviation and ![]() is given.
is given.
Step 1 - Hypothesis: The claim that ![]() or 6.814 = 7.0, the null hypothesis.
or 6.814 = 7.0, the null hypothesis.
Since x-bar is smaller than ![]() ,
the alternate hypothesis is 6.814 < 7.0.
,
the alternate hypothesis is 6.814 < 7.0.
H0 : ![]() =
6.814=7.0
=
6.814=7.0
Ha : ![]() .
.
Step 2. Select level of significance:
This is given as ![]() (2%)
(2%)
Step 3. Test statistics and observed value.
Step 4. Determine the critical region (favors Ha)
For alpha = 0.02 at the lower end of the acceptable region (Pr[a]=0.02), z = -2.06
From reference
table (search for z with Pr[z=? ] = 0.02.
 |
Step 5. Make decision.
The observed z = -1.17, and since -1.17 is not in the critical region
(red ![]() ),
we do not reject H0 in favor of Ha.
),
we do not reject H0 in favor of Ha.
So there is not enough evidence to justify the alternate hypothesis that the new mean of 6.814 is lower than 7.0.