2. Shows frequencies or magnitude of data
3. Time plotted on x-axis (horizontal axis)
4. Can have many different lines representing different data types
5. X-axis mostly discrete values
|
|
Graphs Line Chart |
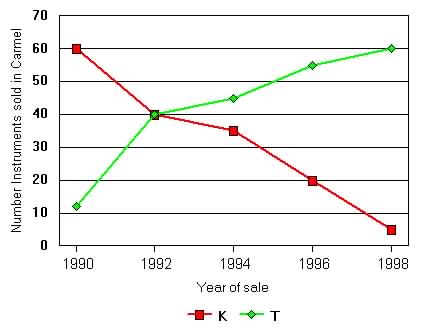
Line Graph:
| 1. Plot
data over time interval
2. Shows frequencies or magnitude of data 3. Time plotted on x-axis (horizontal axis) 4. Can have many different lines representing different data types 5. X-axis mostly discrete values |
| Line Graph
|