If the sample size is small (![]() )
and the sample distribution is normal or approximately normal, then the
Student's
t distribution and associated statistics can be used to determine
a test for whether the sample mean = population mean.
)
and the sample distribution is normal or approximately normal, then the
Student's
t distribution and associated statistics can be used to determine
a test for whether the sample mean = population mean.
That is, when the sample size is less than 30 we can use the student's t statistics, t to compare the sample mean against the population mean using value of the sample standard deviation to estimate the sample standard deviation if it is not known.
There are three questions one may ask when comparing two means:
Question 1: : Is ![]() ? Ha (Two-tailed test)
? Ha (Two-tailed test)
Question 2: : Is ![]() ? Ha (Right-tailed test)
? Ha (Right-tailed test)
Question 3: : Is ![]() ? Ha (Left-tailed test)
? Ha (Left-tailed test)
1. Know the statistics used to test ![]() for small sample size: The
Student's t statistics.
for small sample size: The
Student's t statistics.
The test statistics is related to the student's t distribution, t.
:
The student's t statistics is similar to the z-score statistics,
z 
The student's t distribution assumes that the sample distribution is
normal or approximately so.
| Student's
t statistics, t
Remember that use can also use the t-statistics for samples with large sample size |
 With this statistics, the population standard deviation,
 | Properties
of the Student's t distribution:
1. There are an infinite number of student t distribution, one for each degree of freedom, df. The number of degrees of freedom is 1 minus the sample size or n-1. The 2. The Student's t distribution is similar to the standard normal distribution in shape: That is it as a mean of t = 0 and the total area under the cure is 1 or the probability density or distribution of the function. 3. As the sample size gets larger the curve gets closer to the standard normal curve. Therefore for sample size >= 30 the z-score statistics can be used.. |
As there are numerous Student's t distribution, so there are numerous tables of reference each approaches the question of the hypothesis differently.
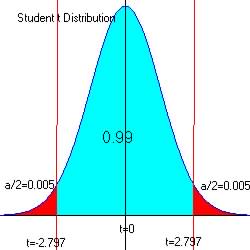
In this text we will use the Upper-tailed test with alpha representing the area under the curve.
See t-statistics reference table
Using this table here are the decision rules for comparing means for
small sample size:
| Decision
rules:
Upper-Tailed Test ( Accept H0 if Reject H0 if Lower-Tailed Test ( Accept H0 if Reject H0 if Two-Tailed Test ( Accept H0 if Reject H0 if |
Reference
table values for Distribution -
|

2. Know how to use appropriate statistics to test if a sample mean is equal to the population mean (small sample size).
3 Types of tests in comparing sample mean to population mean:
When comparing the sample mean, ![]() to the population mean (
to the population mean (![]() is known and
is known and ![]() is unknown) there are 3 questions to considered:
is unknown) there are 3 questions to considered:
Question 1:
: Is ![]() ? Ha (Two-tailed test)
? Ha (Two-tailed test)
Question 2:
: Is ![]() ? Ha (Right-tailed test
or Upper-tailed)
? Ha (Right-tailed test
or Upper-tailed)
Question 3:
: Is ![]() ? Ha (Left-tailed test
or Lower-tailed)
? Ha (Left-tailed test
or Lower-tailed)
Question 1:
Is ![]() ? Ha (Two-tailed test)
? Ha (Two-tailed test)
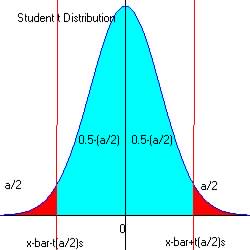
| Is Is the new mean different from the population mean? Here we use a two-tailed test by computing the confidence
interval for the test at the level of significance If the test statistics for t falls outside this interval we decide that the means differs, we chose the alternate hypothesis, Ha Otherwise we have no reason to think that they differ, H0 |
 |
By Examples:
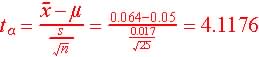
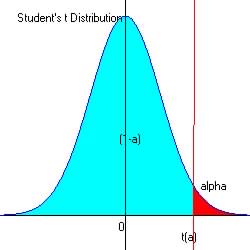
Problem 1. The output of a chemical process for manufacturing Snail Hail is monitored by taking a sample size of n = 25 vials to determine the level of impurities. The null hypothesis is that the mean level is exactly 0.05 gram per liter. If the mean level is too small, the process will be stopped and the tanks purged. Otherwise, the process will continue. A two-tailed test applies, and the mean from the sample is 0.064 with a standard deviation of 0.017. At a significant level of alpha = 0.01, should the process be stopped and the tanks purged?
Given ![]() ,
n = 25 (sp small sample size, use the student's t distribution), s
= 0.017 and since, and
,
n = 25 (sp small sample size, use the student's t distribution), s
= 0.017 and since, and ![]()
Step 1 - Hypothesis: The claim that ![]() or 0.064 = 0.05, the null hypothesis.
or 0.064 = 0.05, the null hypothesis.
The alternate hypothesis is that ![]()
H0 : ![]() =
0.05
=
0.05
Ha :![]() or
or ![]()
Step 2. Select level of significance:
This is given as ![]() (1%)
(1%)
So for two-tailed test: ![]()
Step 3. Test statistics and observed value.
Step 4. Determine the critical region (favors Ha)
For ![]() and df = 25 - 1 = (n-1)= 24, t0.005
= 2.7970
and df = 25 - 1 = (n-1)= 24, t0.005
= 2.7970
 |
Step 5. Make decision.
The observed z = 4.1176, and since 4.1176 > 2.797 and in the critical region, we reject H0 in favor of Ha.
So the new mean of the process should be stopped and the tanks purged.
Question 2:
Is ![]() ? Ha (Right-tailed test)
? Ha (Right-tailed test)
| Is Is the new mean greater than the population mean. Here we use
a right-tailed test by computing the positive t-statistics for the
test at the level of And if the test statistics for t falls within the critical region (red)
we decide that Otherwise we have no reason to think that they differ, Ha |
 |
By Examples:
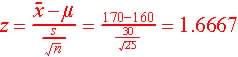
Problem 2. We need to test the hypothesis that a sample of n = 25, with a mean of 170 and standard deviation of 30at a significance level of alpha = 0.05 (a upper-tailed test) whether:
![]() .
.
Given ![]() ,
n = 25 ( small, n< 30 so use t-statistics), s
= 30 and since,
,
n = 25 ( small, n< 30 so use t-statistics), s
= 30 and since, ![]()
Step 1 - Hypothesis: The claim that ![]() or 170 = 160, the null hypothesis.
or 170 = 160, the null hypothesis.
Since x-bar is smaller than ![]() ,
the alternate hypothesis is 170 > 160.
,
the alternate hypothesis is 170 > 160.
H0 : ![]() =
160
=
160
Ha : ![]() .
.
Step 2. Select level of significance:
This is given as ![]() (5%)
(5%)
Step 3. Test statistics and observed value.
Step 4. Determine the critical region (favors Ha)
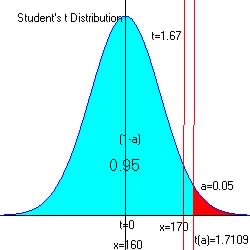
For alpha = 0.05 at the upper end of the acceptable region (Pr[1-a]=0.95), t = 1.7109
From reference
table (search for t with df = 24 = 25 -1, and alpha = 0.05.
 |
Step 5. Make decision.
The observed t = 1.6667, and since 1.67 < 1.71 and is not in the critical region, we have no reason to reject H0 in favor of Ha.
So the new mean of 170 is not significantly greater than 160.
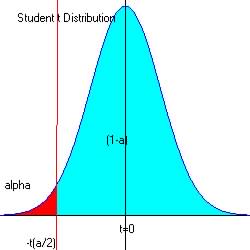
Question 3:
Is ![]() ? Ha (Left-tailed test)
? Ha (Left-tailed test)
| Is Is the new mean less than from the population mean. Here we use
a left-tailed test by computing the t-statistics for the test at
the level of And if the test statistics for t falls within the critical region (red)
we decide that Otherwise we have no reason to think that they differ, Ha |
 |
By Examples:
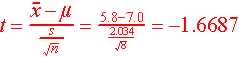
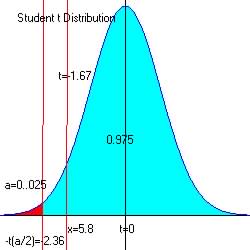
Problem 3. A sample of 8 observations averages 5.8 and the standard deviation is 2.034. Is this mean less than the existing mean of 7.0? Test this hypothesis using a 2.5% level of significance.
Given ![]() ,
n =8 (small so use t statistics), s = 2.034
and
,
n =8 (small so use t statistics), s = 2.034
and ![]() is given.
is given.
Step 1 - Hypothesis: The claim that ![]() or 5.8 = 7.0, the null hypothesis.
or 5.8 = 7.0, the null hypothesis.
Since x-bar is smaller than ![]() ,
the alternate hypothesis is 5.8 < 7.0.
,
the alternate hypothesis is 5.8 < 7.0.
H0 : ![]() =
5.8=7.0
=
5.8=7.0
Ha : ![]() .
.
Step 2. Select level of significance:
This is given as ![]() (2.5%)
(2.5%)
Step 3. Test statistics and observed value.
Step 4. Determine the critical region (favors Ha)
For alpha = 0.025 at the lower end of the acceptable region t = -2.3646
From reference
table (search for t with alpha = 0.025 and df = 7 =8-1)
and since lower tail t = -
 |
Step 5. Make decision.
The observed t = -1.67, and since -1.67 is not in the critical region
(red ![]() ),
we do not reject H0 in favor of Ha.
),
we do not reject H0 in favor of Ha.
So there is not enough evidence to justify the alternate hypothesis
that the new mean of 5.8 is not significantly lower than 7.0.