Chi-Square Test for Homogeneity
The chi-square test for homogeneity is a test
made to determine whether several populations are similar or equal or homogeneous
in
some characteristics.
1. Know what is meant by the test for homegeneity.
The test for Homogeneity is evalauting the equality of several
populations of categorical data. The test asked whether 3 or more
populations are equal with respect to some characteritics.
The homogeneity chi-square test statistics is computed exactly the same
as the test for independence using contingency
table as
when determining the independence of charateristics chi-square statistics.
The only difference between the test for independence and the homogeneity test is the stating of the null hypothesis:
Homogeneity tests a null hypothesis asserting that various populations
are homogeneous or equal with respect to some charateristics
of interest against an alternate hypothesis claiming that they are
not.
If ![]() is populations i-th (categorized) then
is populations i-th (categorized) then ![]() (the null hypothesis)
(the null hypothesis)
(note other statistics could be used to compare pairwair combinations
of all possible pairs; however if there is a mistake in judging the
goodness of one or more of the pairs, then the error introduced will
be too large to effectively make as good a claim as the chi-square
homegeneity test would.)
2. Know how to compute the chi-square homegeniety test statistics.
Problem: An ads agency wishes
to determine if there are any differences with respect to reader recall
among 3 kinds magazine ads.
One ad is humorous, the second is quite technical and
the third is a pictorial comparision of competing brands. Appropriate
random
sampling, response validations are taken and conducted to determine
how well partiscipants remembered each ads on a national / regional
level. Those partiscipants selecting the correct ad are labeled as
remembered
and those unable to select the correct ads are labeled
nonremembered.
| Type of Ads | |||
| Reader Recall | 1. Humorous | 2. Technical | 3. Comparison |
| 1. Rememebered | 25 | 10 | 7 |
| 2. Not Rememebered | 73 | 93 | 108 |
Step 1. Make a problems statement: (becomes the hypothesis statement, Ho ).
The main question to answer is: are there any differences in recalling
property (mnemonic) of the three kinds of advertisements?
This may be expressed as proportions of readers who either remembered
or not rememberd the ads.
Hypothesis:
If ![]() represent the proportion rememebering the i-th ad (i=1 for Humorous, i=2
for Technical and i=3 for Comparision) then
represent the proportion rememebering the i-th ad (i=1 for Humorous, i=2
for Technical and i=3 for Comparision) then
the null hypothesis is:
![]()
The ads make no difference in (helping) reader recall.
Ha: Ho is not true. (alternate hypothesis): There is a difference between the ads in terms of reader recall.
Step 2. Choose ![]() ,
the significance level of the test.
,
the significance level of the test.
If you want the be 95 % certain that the test is true, then ![]() = 0.05 =(100-95)/100
= 0.05 =(100-95)/100
The df = (r-1)(c-1), or (m-1)(k-1) = (3-1)(2-1)=2
So df = 2
Step 3. Look up ![]() from chi-square
table:
from chi-square
table:
| df | ||||||||||
| 2 | 0.01 | 0.02 | 0.05 | 0.1 | 0.21 | 4.61 | 5.99 | 7.38 | 9.21 | 10.6 |
For d.f. = 12, ![]()
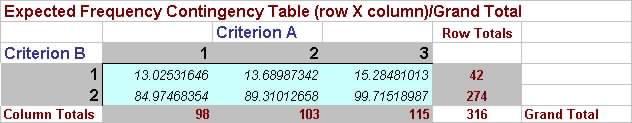
Step 4. (4) Determine or compute ![]() ,
The Expected Frequencies:
,
The Expected Frequencies:
The following table is the Expected Frequencies, E of each cells
in the study:
 |
Step 5. Compute ![]()
 |
![]() =
19.02221
from computational
table above.
=
19.02221
from computational
table above.
Step 6 Perform test chi-square test: ![]() ,
,
Since ![]() ,
i.e. 19.0221 > 5.99, Then we assume
that the null hypothesis of equaly proportions must be rejected
,
i.e. 19.0221 > 5.99, Then we assume
that the null hypothesis of equaly proportions must be rejected
Make Conclusion or inference:
We conclude that the three ads are not equally easy to remembered.
So Ha (alternate hypothesis) is favored by this test.
3. Know how to calculate the contingency coefficient, C.
The contingency coefficient, C is a statistics that measures
the strength of the relationship between variables or categories in a
contengency table of the chi-square statistics when the test suggest
that variables or categories are related.
It is interpretated like the correlation coefficient.
![]() ,
where
,
where ![]() is the chi-square statistics obtained for the contingency table and n is
the grand total of all frequencies.
is the chi-square statistics obtained for the contingency table and n is
the grand total of all frequencies.
This statistics is rarely used by practitioners.
Workshop Problem (test for Homogeneity)
A dietician wants to know if the time of day influences the tendency
to consume coffee. The following data represents the beverage
purchases for a random sample of cafeteria customers.
| Early a.m. | Late a.m. | Early p.m. | Late p.m. | |
| Number for coffee | 3 | 5 | 8 | 11 |
| Number for other | 52 | 48 | 51 | 47 |
The null huypothesis is that the proportions of coffee purchases throughout
the day are identical. Using alpha of 0.05, what conclusion
should the dietician reach?