Central tendency is a measure or concept that
attempts to describe the location of value around which sample data tends
to cluster.
Such statistical parameters liek mean, median
and mode are measure of central tendency.
1. Know the two major classes of summary numerical values of quantitative data.
Central tendency is a measure of location or a value around which the observations from a sample tends to cluster and which typifies their magnitude.
Example: arithmetic mean and median
Dispersion is a measure of variability or dispersion among observation values. It gives an indication of the distribution or spread of the data.
Example: range and standard deviation.
The arithmetic mean is one of the most commonly used measures of central tendency.
1. Know the meaning of and how to determine the arithmetic mean.
The arithmetic mean is a statistical parameter used to measure the average of a group of data and is defined as the sum of all the data divided by the number of data values.
The number of data value is often called the sample size, and is denoted by the symbol, n.
![]()
The summation sign , ![]() ,
is used to add a series of values and the sample mean is denoted by
,
is used to add a series of values and the sample mean is denoted by ![]() .
.
![]() ,
where
,
where ![]() for i = 1 to n data values.
for i = 1 to n data values.
Example: Calculate the arithmetic mean for the following data:
23,
24, 32, 21, 36, 28, 25, 30.
| i | 1 | 2 | 3 | 4 | 5 | 6 | 7 | 8 | n=8 |
| xi | 23 | 24 | 32 | 21 | 36 | 28 | 25 | 30 |
![]() ,
so the mean is 27.38
,
so the mean is 27.38
2. Know the symbols used to represent the mean.
The sample mean is represented by the symbol, x-bar or ![]()
The population mean (sample include all members of the population)
is represented by the Greek symbol, mu or ![]() .
.
1. Know the meaning of and how to determine the median.
The sample median is the central or "middle" observation for a group of data arranged in increasing order and it is denoted by the symbol, m.
In general the median is the value above or below which lies an equal number of an arranged (increasing sequence) set of observations.
The population median is denoted by the symbol, M and is determined the same way as the sample median.
To find the median of a set of data, first list the values from lowest to highest and then select the central value if there is an odd number of values or average the two central values if there is an even number of observations.
Example: Find the median of the following data: 23, 24, 32, 21, 36, 28, 25, 30.
Organized in increasing order: 21, 23, 24, 25, 28, 30, 32, 36 . (Even number of values)
Note that 8 is an even number so we average the two central values: ![]()
So the median, m is 26.5
2. Know the similarities and differences between the mean and the median.
Both the mean and the mean are averages, the mean is the average of the variates and the median is the average of the position of the set of observations.
A measurement that is not easily resistance to extreme values in the data set is called a resistant measure.
The median is a resistant measure of central tendency.
Example: the data set 21, 23, 24, 25, 28, 30, 32, 36 above if the last value was replace by 200 the median would still be the same.
The mean is more stable than the median. So over time with additional values collected, offers a reliable measure of central tendency.
The Mode
1. Know the meaning of the mode and how to determine it.
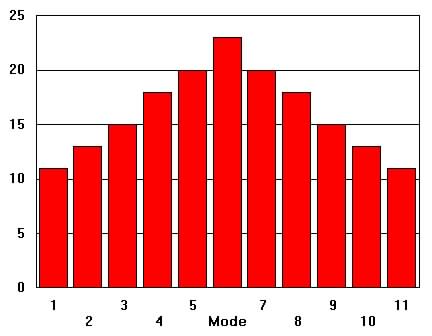
The mode is a measure of central tendency and is the most frequently occurring value(s).
Example: Find the mode of the following data set: 21, 25, 24, 25, 29, 20, 32, 36 .
The mode is 25 since it is the value that occurs more frequently than the other values.
When the data set are grouped into classes (categorized), then the mode
is represented by the midpoint of the interval having
the greatest class frequency.
Figure 2c.1 Mode (most frequent x-value)
 |
Mean, Median and Mode
1. Know the characteristics of measures of the mean, median, and mode.*
The mean is the point at the mathematical center or balance point of the distribution. It often does not correspond to an actual value, from the set of observation. The sum of deviation of all the data around the mean is equal to zero. And the sum of square deviation is at its minimum value when compared to other points.
Sum of all (values - mean) = 0 = ![]() ,
where xi is the i-th
value, and x-bar is the mean.
,
where xi is the i-th
value, and x-bar is the mean.
Sum of squares (values - mean) is minimum => ![]()
The median is the point dividing the distribution in half. 50% of the observations falls on both sides of the median.
The median is the point around which the sum of the absolute values of the deviations of the observations from the median is a minimum.
Sum absolute (values - median) is minimum => ![]()
The mode is the score with the most frequent occurring data. It often is indicated by the highest point on a graph (x-axis value).
2. Know situations when the mean, median, and mode are preferred.
The mean is preferred when there is a need for a precise measure of a group of data and every value in the group is important.
It is most preferred when reporting central tendency in research.
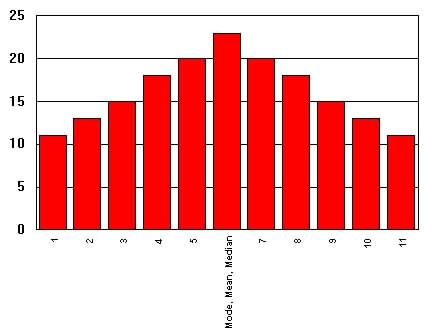
Most distributions that are almost symmetrical have their mean, mode, and median equal or very close in value. (see Figure 2c.2)
It is not appropriate to use the mean when there are extreme cases or observations that should not be used in the distribution (called outliers).
When there are extreme observations that should be excluded from the data, the median is preferred.
The median is a better estimate of the typical since half the observed values are above and below it.
The median is a resistant measure of central tendency.
The mode is preferred when the most common values are needed.
3. Know the relative positions of the median,
mean and mode of common types of distributions:
| Figure
2c.2 Symmetrical Distribution
Mean = Median= Mode |
|
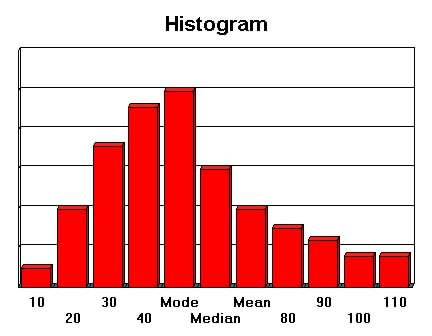
| Figure 2c.3 Positively Skewed
Distribution
|
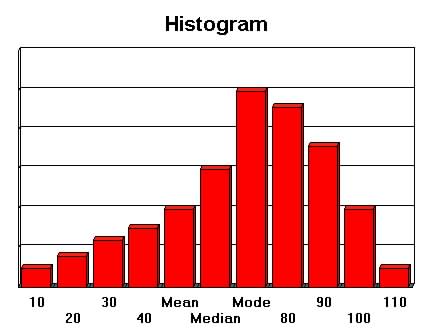
Figure 2c.4 Negatively Skewed
Distribution
|
4. Know how to calculate the mean, median and mode form grouped or categorized data.
Often after data is summarized or categorized it is difficult to recreate the raw data used to determined the mean, median or mode or other parametric statistics. However, it is often easy to obtained good approximations to the sample mean, median, and mode from the summarized data.
Approximation to the sample mean.
The approximation to the sample mean is determined from the weighted average which is the sum of the midpoints (class or category) times their relative frequencies.
Sample mean,
![]() ,
where X is the class midpoint, f is the class
frequency and n is the sample size.
,
where X is the class midpoint, f is the class
frequency and n is the sample size.
Example: The first 3 columns are given, find the mean (weighted
mean is 19.78)
| Fuel Consumption, MPG | Number of Cars
f |
Class Interval Midpoint
X |
Relative frequency
|
|
| 14-16 (Under) | 9 | 15 | 0.09 | 1.35 |
| 16-18 (Under) | 13 | 17 | 0.13 | 2.21 |
| 18-20 (Under) | 24 | 19 | 0.24 | 4.56 |
| 20-22 (Under) | 38 | 21 | 0.38 | 7.98 |
| 22-24 (Under) | 16 | 23 | 0.16 | 3.68 |
| Totals | 100 | 1 |
Approximation to sample median
using grouped data.
The median is the value of which ½ the data falls above and below.
| Fuel Consumption, MPG
W=2 |
j | Number of Cars
f n=100 |
Cumulative Frequency
CFj-1 |
| 14-16 (Under) | 1 | 9 | 9 |
| 16-18 (Under) | 2 | 13 | 13+9=22 |
| 18-20 (Under) | 3 | 24 | 22+24=46 |
| 20-22 (Under) | 4 | 38 | 46+38=84 |
| 22-24 (Under) | 5 | 16 | 84+16=100 |
![]()
Where jth class interval contains m (50%) - j= 4
Lj is the lower limit of the j-th class interval (20.0)
CFj-1 is the cumulative frequency of the (j-1) st class interval (46)
W is the class interval width, (2).
So ![]()
Finding the mode
using grouped data
The mode is easily determined from group data. It is the midpoint of the class interval containing the highest frequency.
From the data consumption data above , the highest frequency, 30 is between the interval 20-22
So the mode ![]()
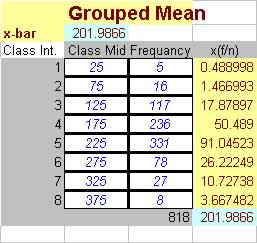
Workshop Problem (Group mean and median): For the sample distribution of floppy disk shown below:
(a) Calculate the sample mean.
(b) Find the sample median.
|
Partial Solution
|
